One thing that drives me crazy: Copying latent class model results from Mplus, pasting them into Excel, and then filtering out the parts of the output that are unnecessary. You can of course speed this process up by using vLookups or some form of indexing on Excel, but it’s still cumbersome. I’m spoiled by Stata, which has custom packages that allow the user to output their results into nicely formatted tables see for example my previous posts.
My solution? Make my own package that does this for Mplus output. I considered doing this in Stata, but I need to wean myself off of Stata and become proficient in programs like R and Python. So, I chose R. I didn’t do this for any particular reason other than that I am taking courses in Python, so I wanted to get more practice in R.
How it works
1. Install the package
If R is not installed on your computer, the first step is actually to install R. In addition to installing R, I recommend installing R Studio, which provides a friendly user interface for R, especially if you’re uncomfortable coding in a command prompt type window.
If R is installed on your computer, go to my github profile and download the LCA2xl_0.0.1.tar.gz file. Place the file in your R library. For example, my R library is “C:/Users/Stella/Documents/R/win-library/3.4”. Then type the following:
#First check that your working directory is set to the same folder you just placed the package in:
getwd()
#--If it isn't, type the following (replace with the correct information):
setwd('C:/Users/Username/Rpath')

#Second, install the package and load it:
install.packages("LCA2xl_0.0.1.tar.gz", type="source", repos=NULL)
library(LCA2xl)

#You may also want to load the following packages:
library(dplyr)
library(tidyr)
library(plyr)
library(stringi)
library(stringr)
library(excel.link)
#--if you need to install them, type: install.packages("package_name", dependencies=TRUE)
2. Load your data
Next, tell R which Mplus.out file you would like to use. (Change your working directory to the correct folder first):
mplusfile<-"example.out"
#Alternatively, you can just use the "example.out" file directly in the function command. Shown below.

#Do not type the following. I am only doing this to give you have an idea of what the file looks like (for a 2 Class Model):
readLines(file("example.out"))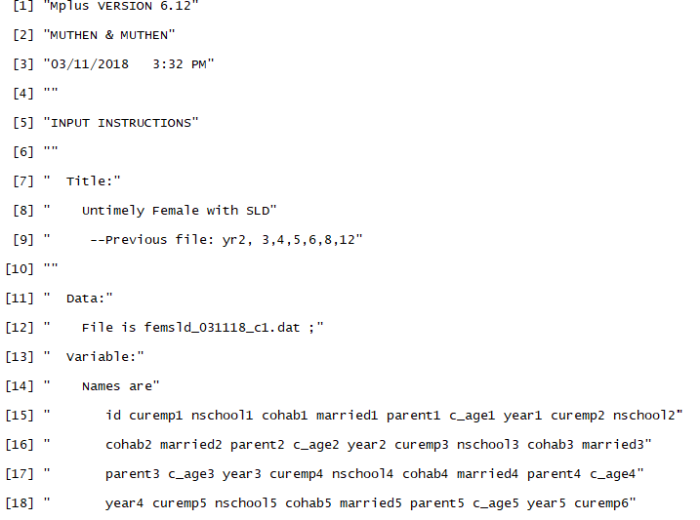
As you can see, it’s a massive file of text that you have to hunt through for the data that you want.
3. Use LCA2xl to extract models
The main function that you will likely want to use is getPScaleResults. This will get the section of the output file that displays the results in probability scale. The section that is relevant is Category 2 for each variable/measure, because this is the probability that the person in this class exhibits a particular trait or, in my case, the probability that a person will experience a particular event. The information you will need in order to use this function, is the usevariable list and the number of classes in the model. Note that you don’t have to provide a usevariable list. It’s better if you do however, because Mplus often truncates variables, or because your variables have nondescriptive names to prevent Mplus from truncating them. If you are okay with your usevariable names that you listed in Mplus, you can use an optional function that I created, called getUsevars. Here’s an example:
#To use the custom function that I provided:
usevars<-getUsevars(mplusfile) #it extracts the list you provided in Mplus
#--you could also just write: usevars<-getUsevars("example.out")

usevars #to view the results
 [1] "CUREMP2" "NSCHOOL2" "COHAB2" "MARRIED2" "PARENT2" "CUREMP3" "NSCHOOL3"
 [8] "COHAB3" "MARRIED3" "PARENT3" "CUREMP4" "NSCHOOL4" "COHAB4" "MARRIED4"
[15] "PARENT4" "CUREMP5" "NSCHOOL5" "COHAB5" "MARRIED5" "PARENT5" "CUREMP6"
[22] "NSCHOOL6" "COHAB6" "MARRIED6" "PARENT6" "CUREMP8" "NSCHOOL8" "COHAB8"
[29] "MARRIED8" "PARENT8" "CUREMP12" "NSCHOOL12" "COHAB12" "MARRIED12" "PARENT12"
#Alternatively, you can assign a list. Just be sure to assign the same number of variables and in the correct order
usevars2<-c("EMPLOYED2","SCHOOL2", "COHAB2", "MARRIED2", "PARENT2",
            "EMPLOYED3","SCHOOL3", "COHAB3", "MARRIED3", "PARENT3",
            "EMPLOYED4","SCHOOL4", "COHAB4", "MARRIED4", "PARENT4",
            "EMPLOYED5","SCHOOL5", "COHAB5", "MARRIED5", "PARENT5",
            "EMPLOYED6","SCHOOL6", "COHAB6", "MARRIED6", "PARENT6",
            "EMPLOYED7","SCHOOL7", "COHAB7", "MARRIED7", "PARENT7",
            "EMPLOYED8","SCHOOL8", "COHAB8", "MARRIED8", "PARENT8")

usevars2
 [1] "EMPLOYED2" "SCHOOL2" "COHAB2" "MARRIED2" "PARENT2" "EMPLOYED3" "SCHOOL3"
 [8] "COHAB3" "MARRIED3" "PARENT3" "EMPLOYED4" "SCHOOL4" "COHAB4" "MARRIED4"
[15] "PARENT4" "EMPLOYED5" "SCHOOL5" "COHAB5" "MARRIED5" "PARENT5" "EMPLOYED6"
[22] "SCHOOL6" "COHAB6" "MARRIED6" "PARENT6" "EMPLOYED7" "SCHOOL7" "COHAB7"
[29] "MARRIED7" "PARENT7" "EMPLOYED8" "SCHOOL8" "COHAB8" "MARRIED8" "PARENT8"
#Now you can extract the results in probability scale
results1<-getProbResults(mplusfile, classes=2, usevariableList=usevars)
#Don't worry about the red text. It's just a warning. I didn't assign attributes to the file. It's unnecessary information and it won't effect your results.
results1 #The results are put into a data frame (dataset)

#You will see pretty similar results if you use your custom variable list
results2<-getProbResults(mplusfile, classes=2, usevariableList=usevars2)
results2
Here is what each data set looks like:
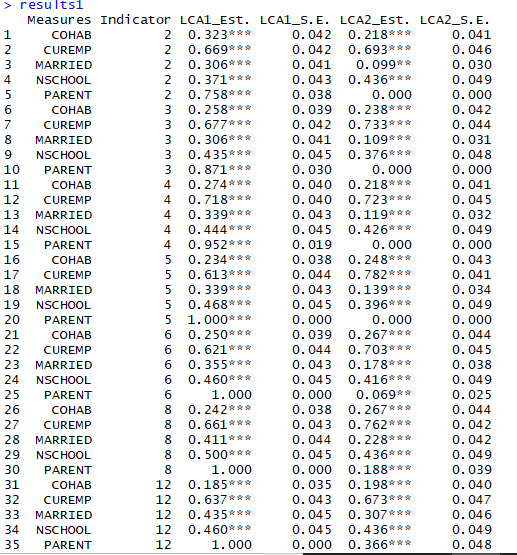
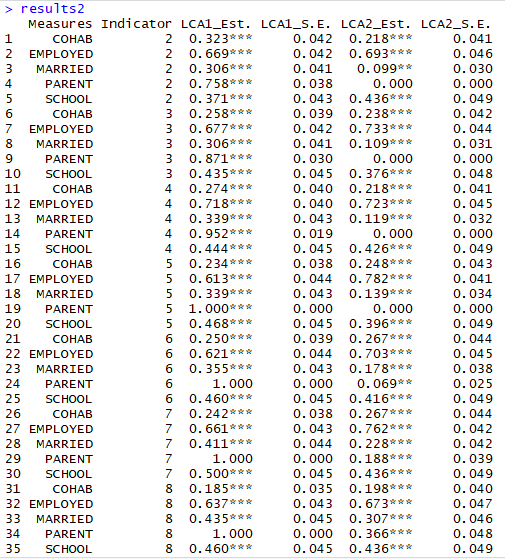
Notice that I extracted the indicator (the number following the variable) and also added stars to the estimates: *** p<.001 **p<.01 *p<.05
4. Export the results to Excel
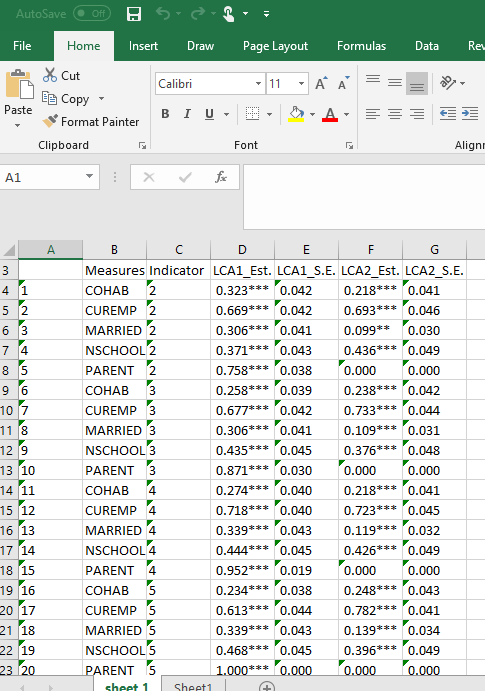
Now you can export the results to an Excel workbook. You also have to option of exporting both models results, if you would like:
listr<-list(results1) #It has to be in list to work
LCA2xl(modelList=listr, returnfile="Results1.xlsx")

#or you can create a list of models to export to Excel:
listresults<-list(results1, results2) #place both data frames in one list
listresults
LCA2xl(modelList=results1, returnfile="Results2.xlsx")
When you run the LCA2xl function, you’ll notice that an Excel Workbook will open on your computer. For the workbook with two models, you should see that each model was saved to a separate sheet.
5. Extras
Lastly, I added some extra functions: functions that extract Tech 11 and Tech 14 output, a function that extracts the average probability of class membership, and a final option that will take the square root of the results in probability scale. The latter function is mainly for graphing–it scales the y-axis. Below, I’ve provided a demonstration of each function.
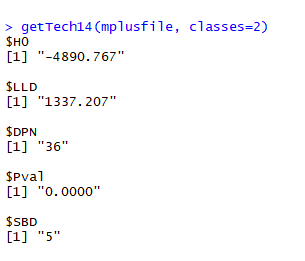
#For Techoutput
getTech11(mplusfile, classes=2)
getTech14(mplusfile, classes=2)
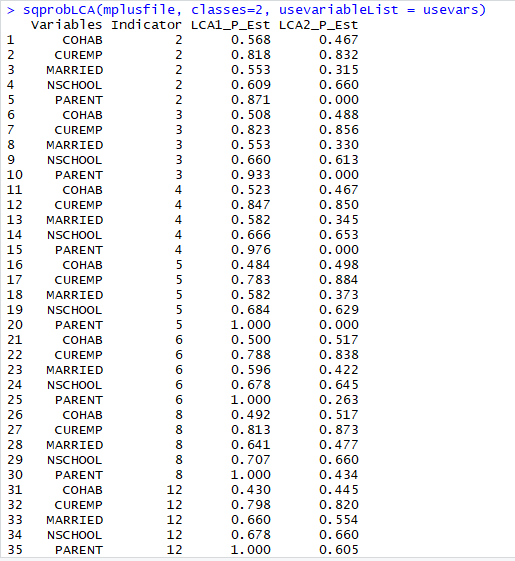
sqprobLCA(mplusfile, classes=2, usevariableList = usevars)
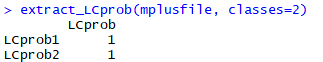
extract_LCprob(mplusfile, classes=2)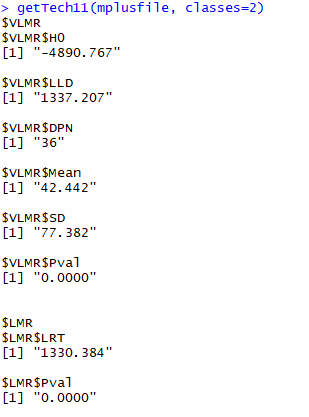
You can add these results to the list of dataframes that you export to Excel if you would like them included in your results.
That’s it! Now go have fun with all that extra time you saved!
